Scientific Visualization Gallery
Figures, animations, and other visualizations from research projects over the years.
Animations
Requesting research data
Minocher, et al. (2021) RSOS | Paper | Code

Citation gates. Papers passing through successive stages of citation and replication over time. From the citation-gates project.
Simulating the spread of an epidemic
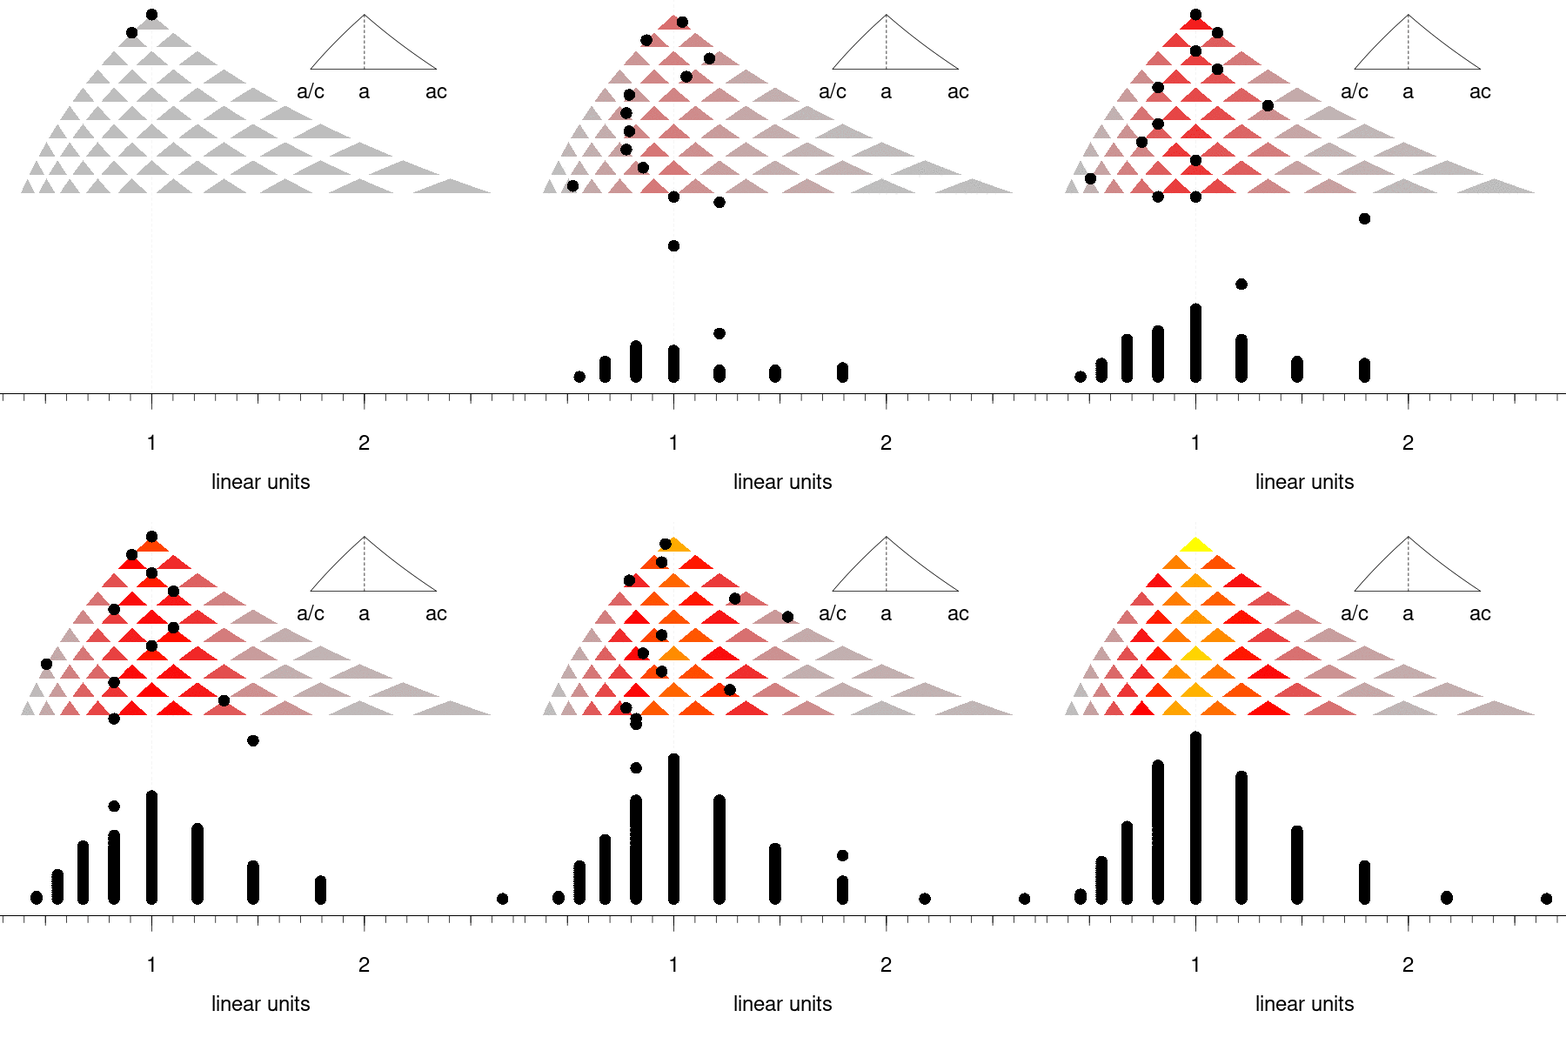
A multiplicative Galton board
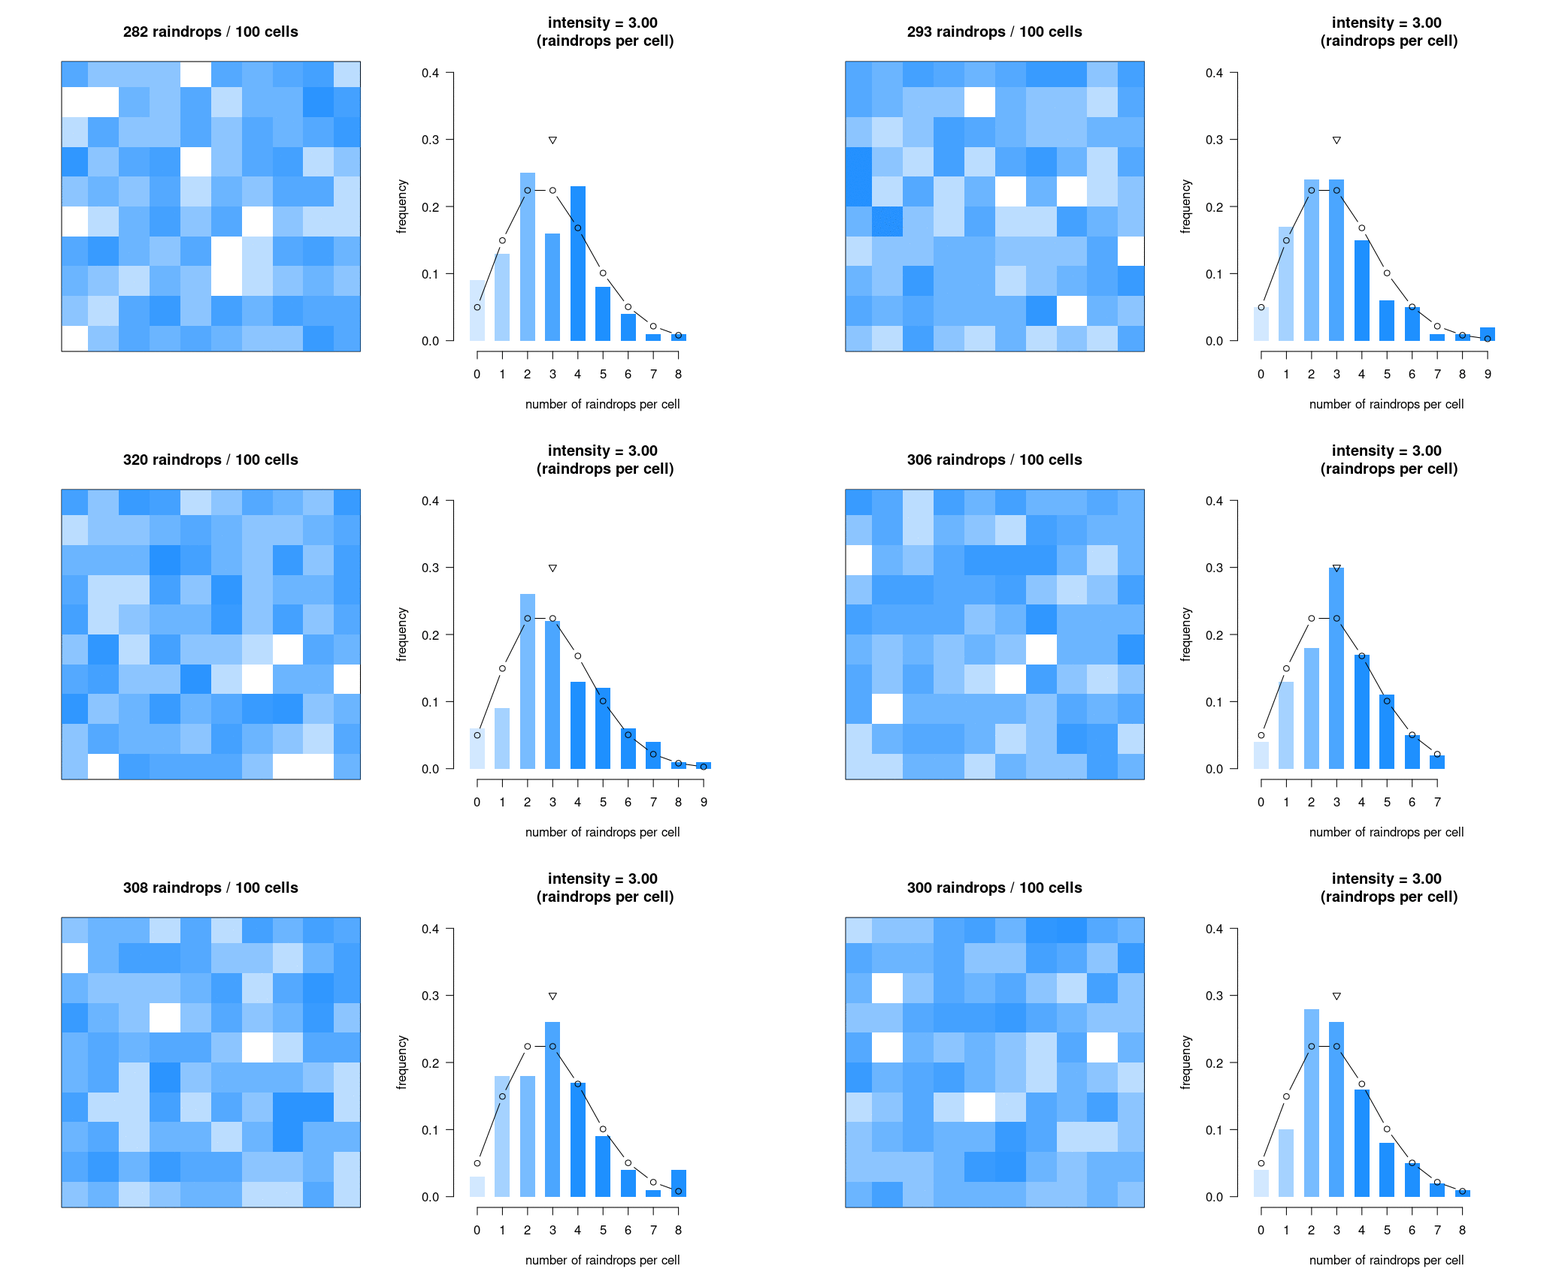
How raindrops make a Poisson distribution
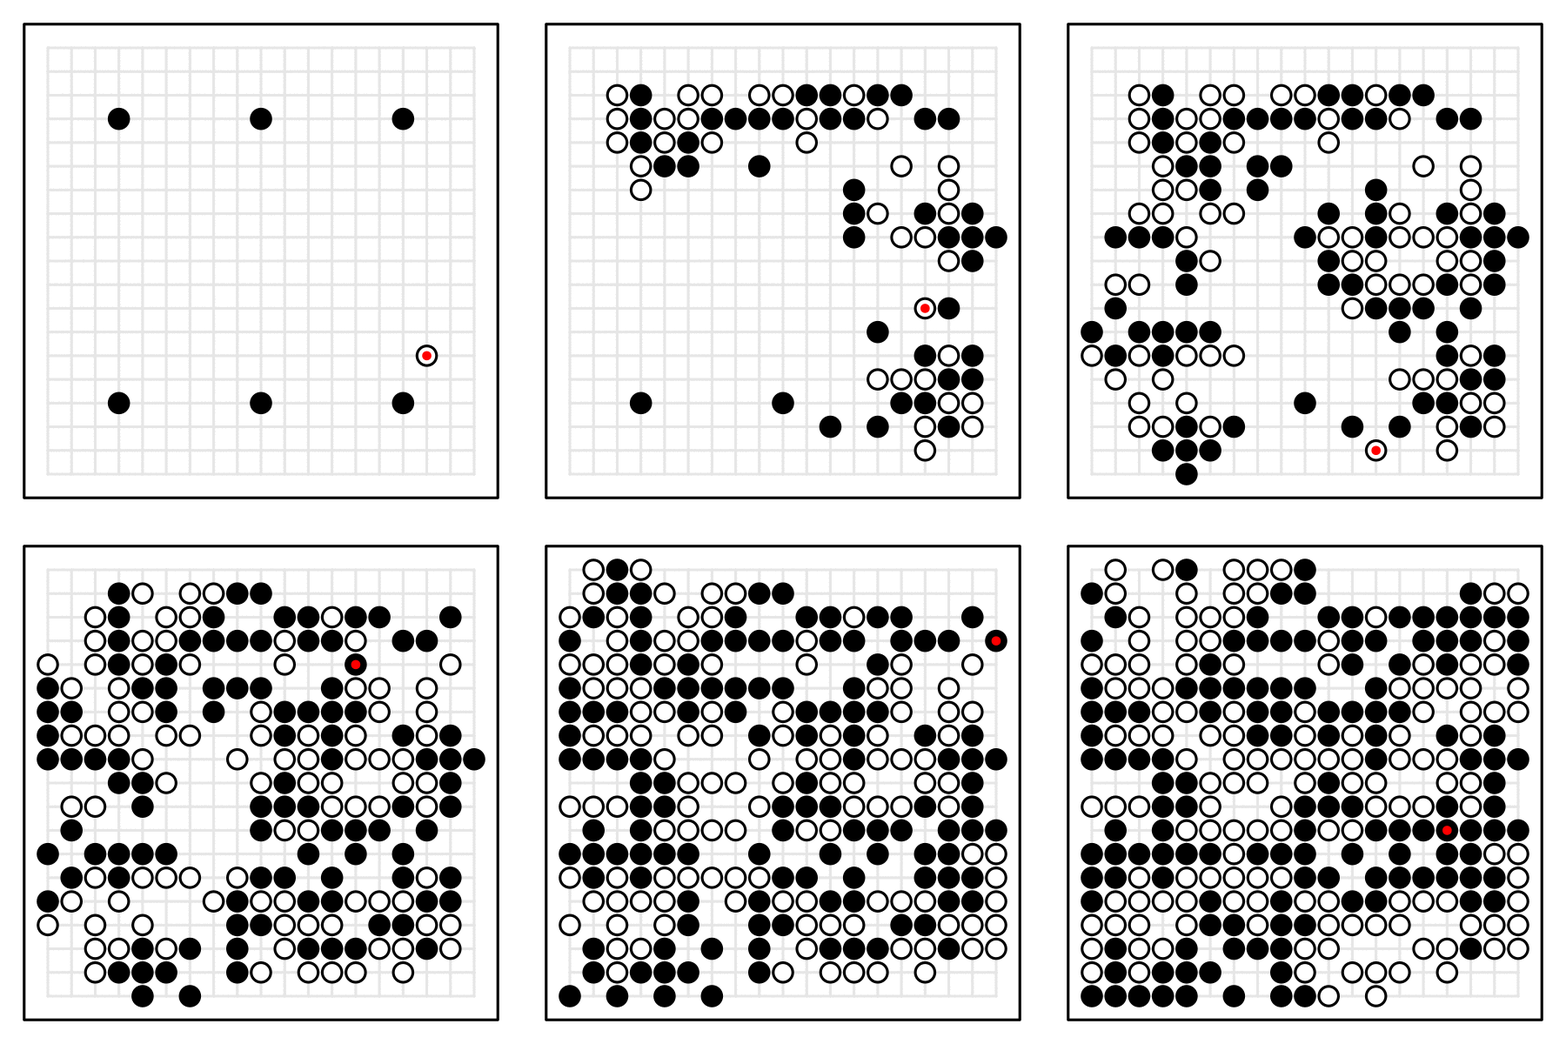
Animating a kifu game record
Images
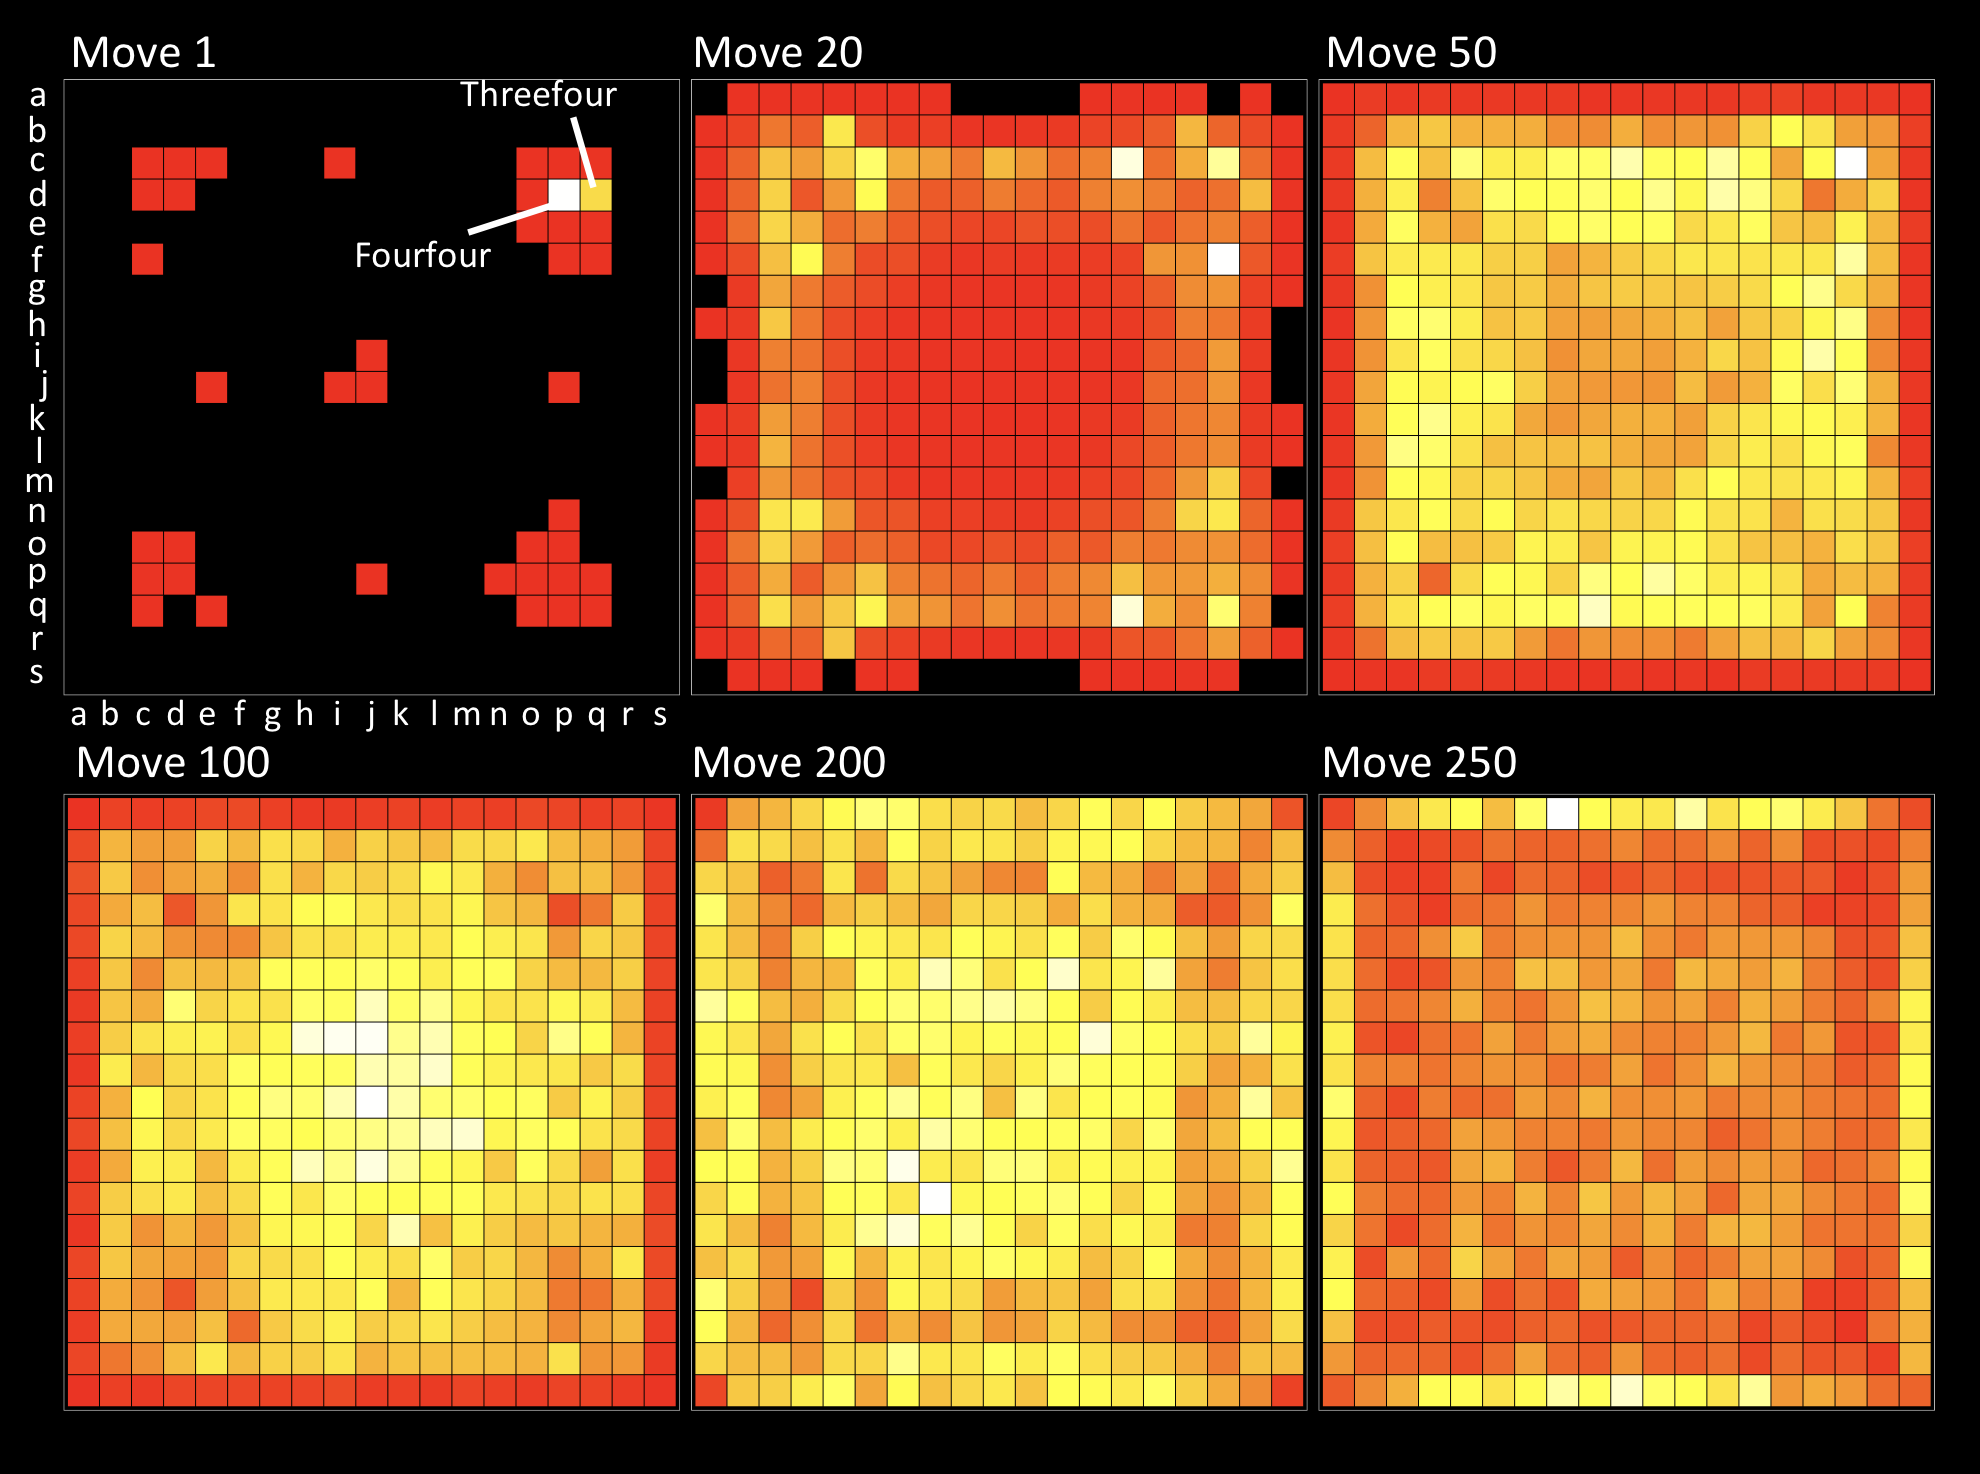
Player focus throughout a Go match
Beheim, Thigpen, McElreath (2014), Evolution and Human Behavior | Code and data | Paper
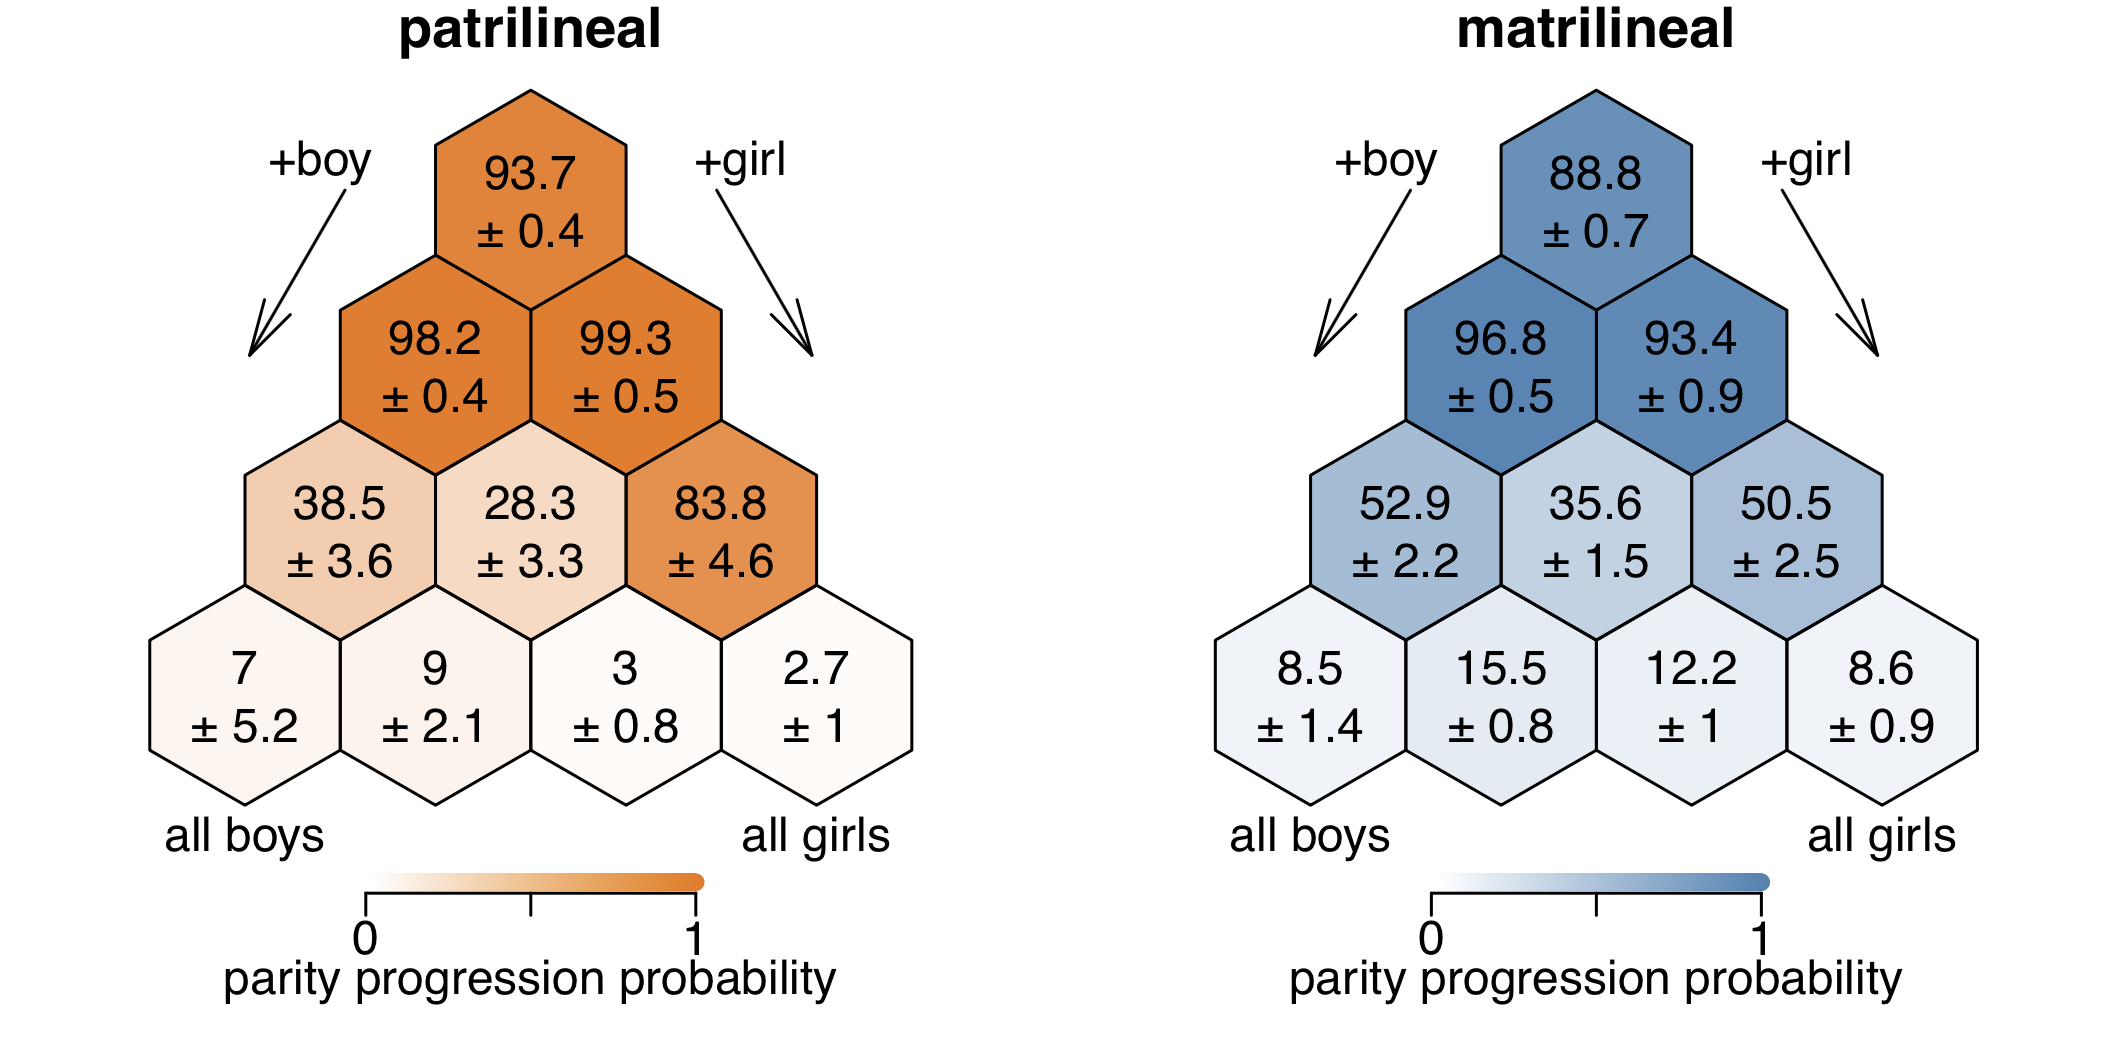
Chances of stopping at a particular number of children
Mattison, Beheim, Chak, Buston (2016), RSOS
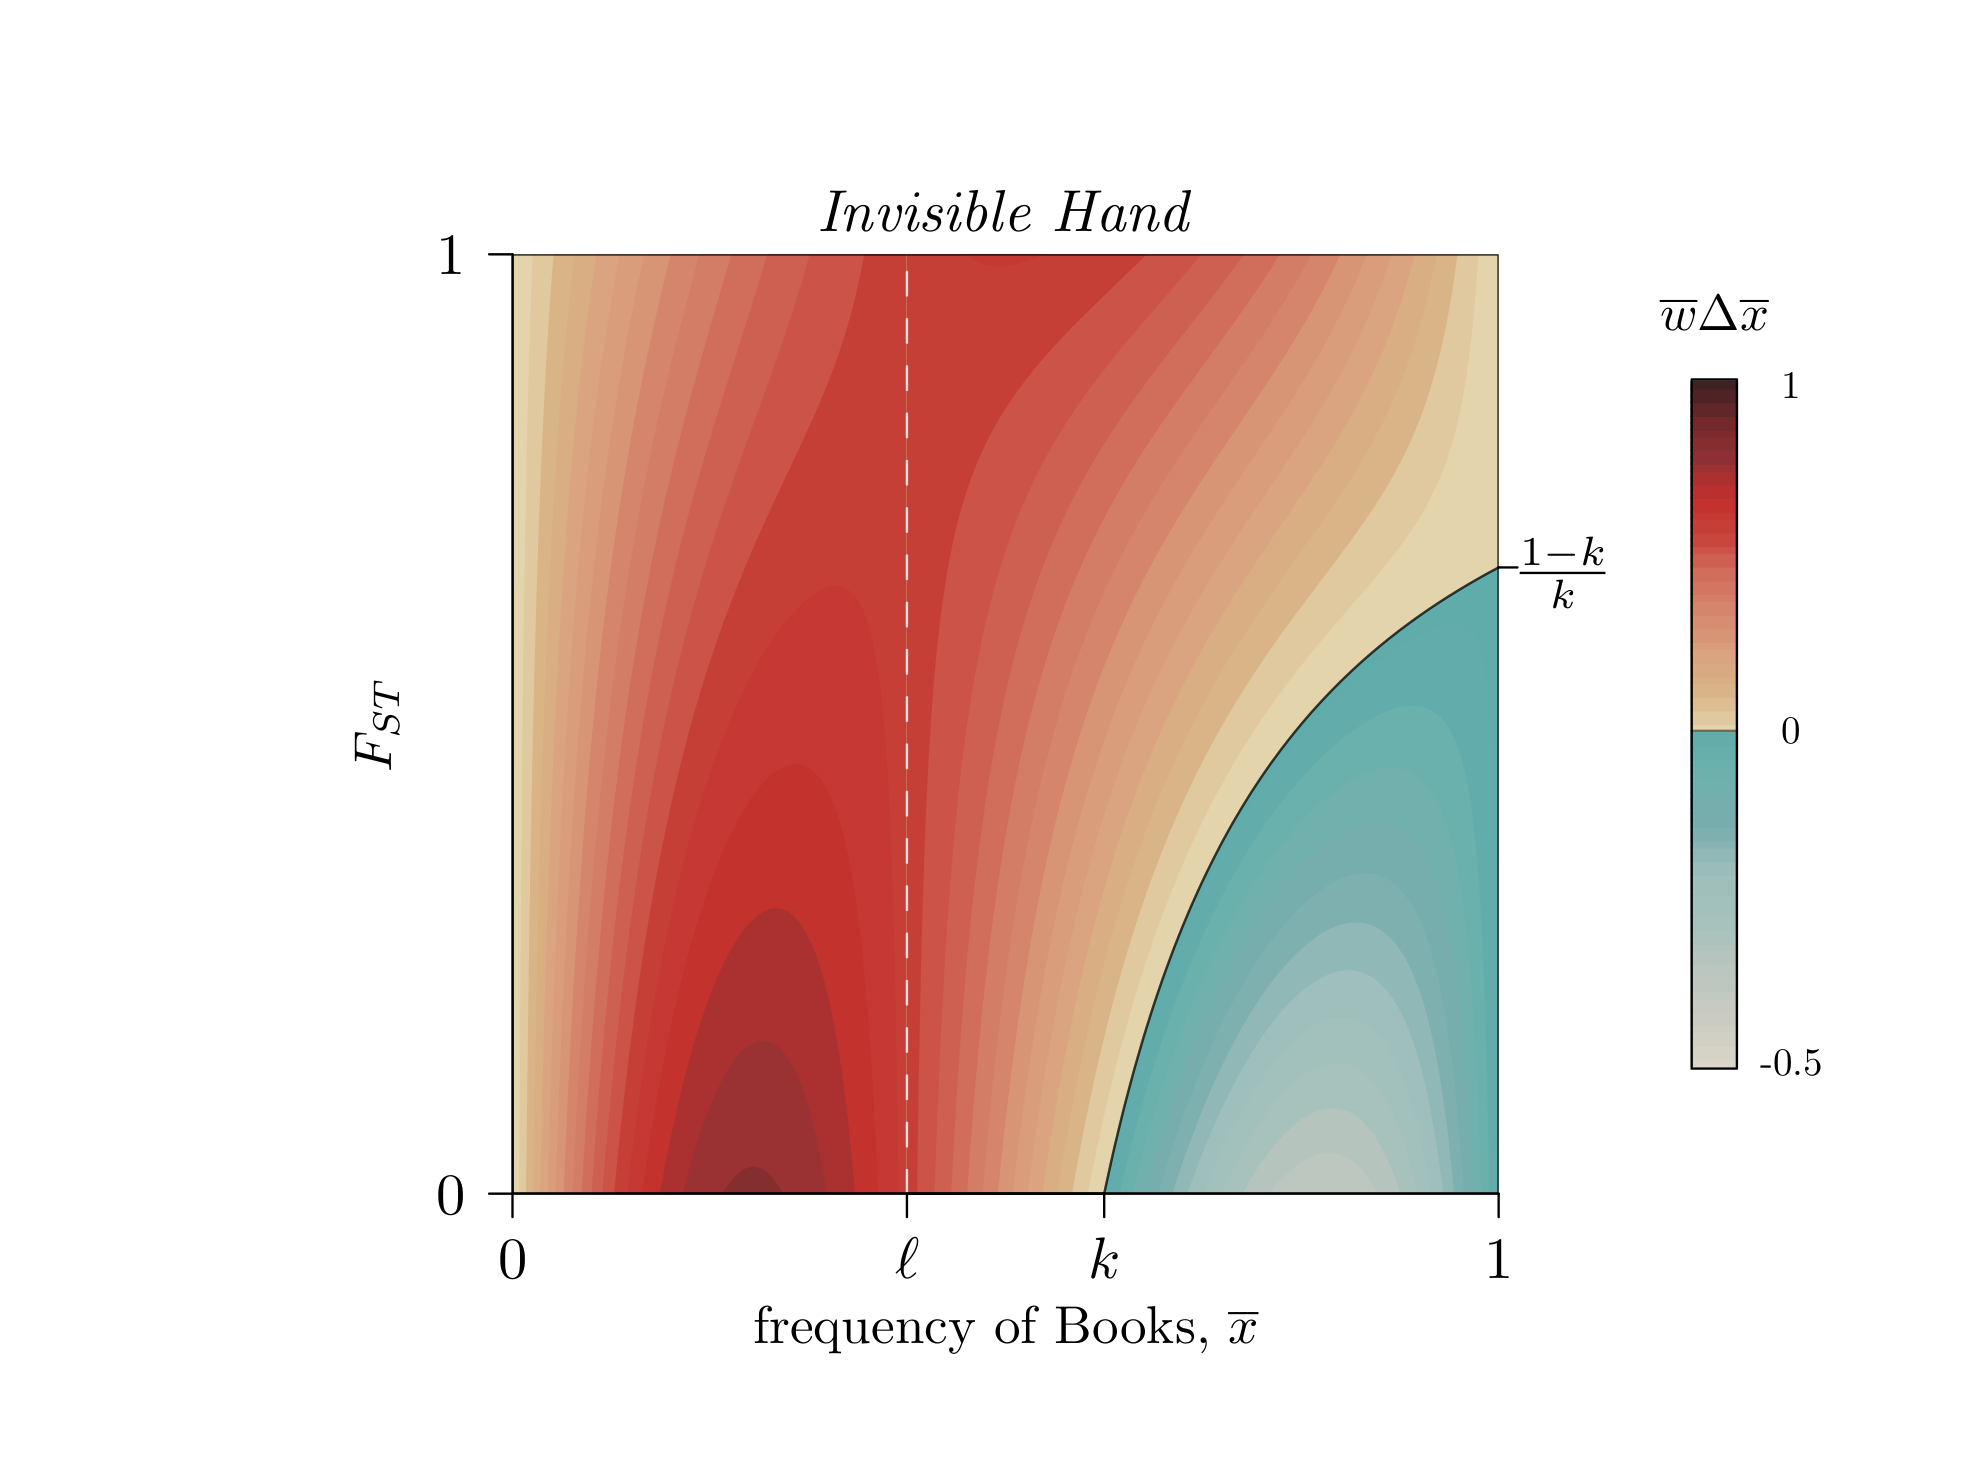
Selection for group-beneficial strategies in a segmented complementarity game
Beheim, Bell (2025) EHS | Code | Paper
Tablet-Based Notetaking
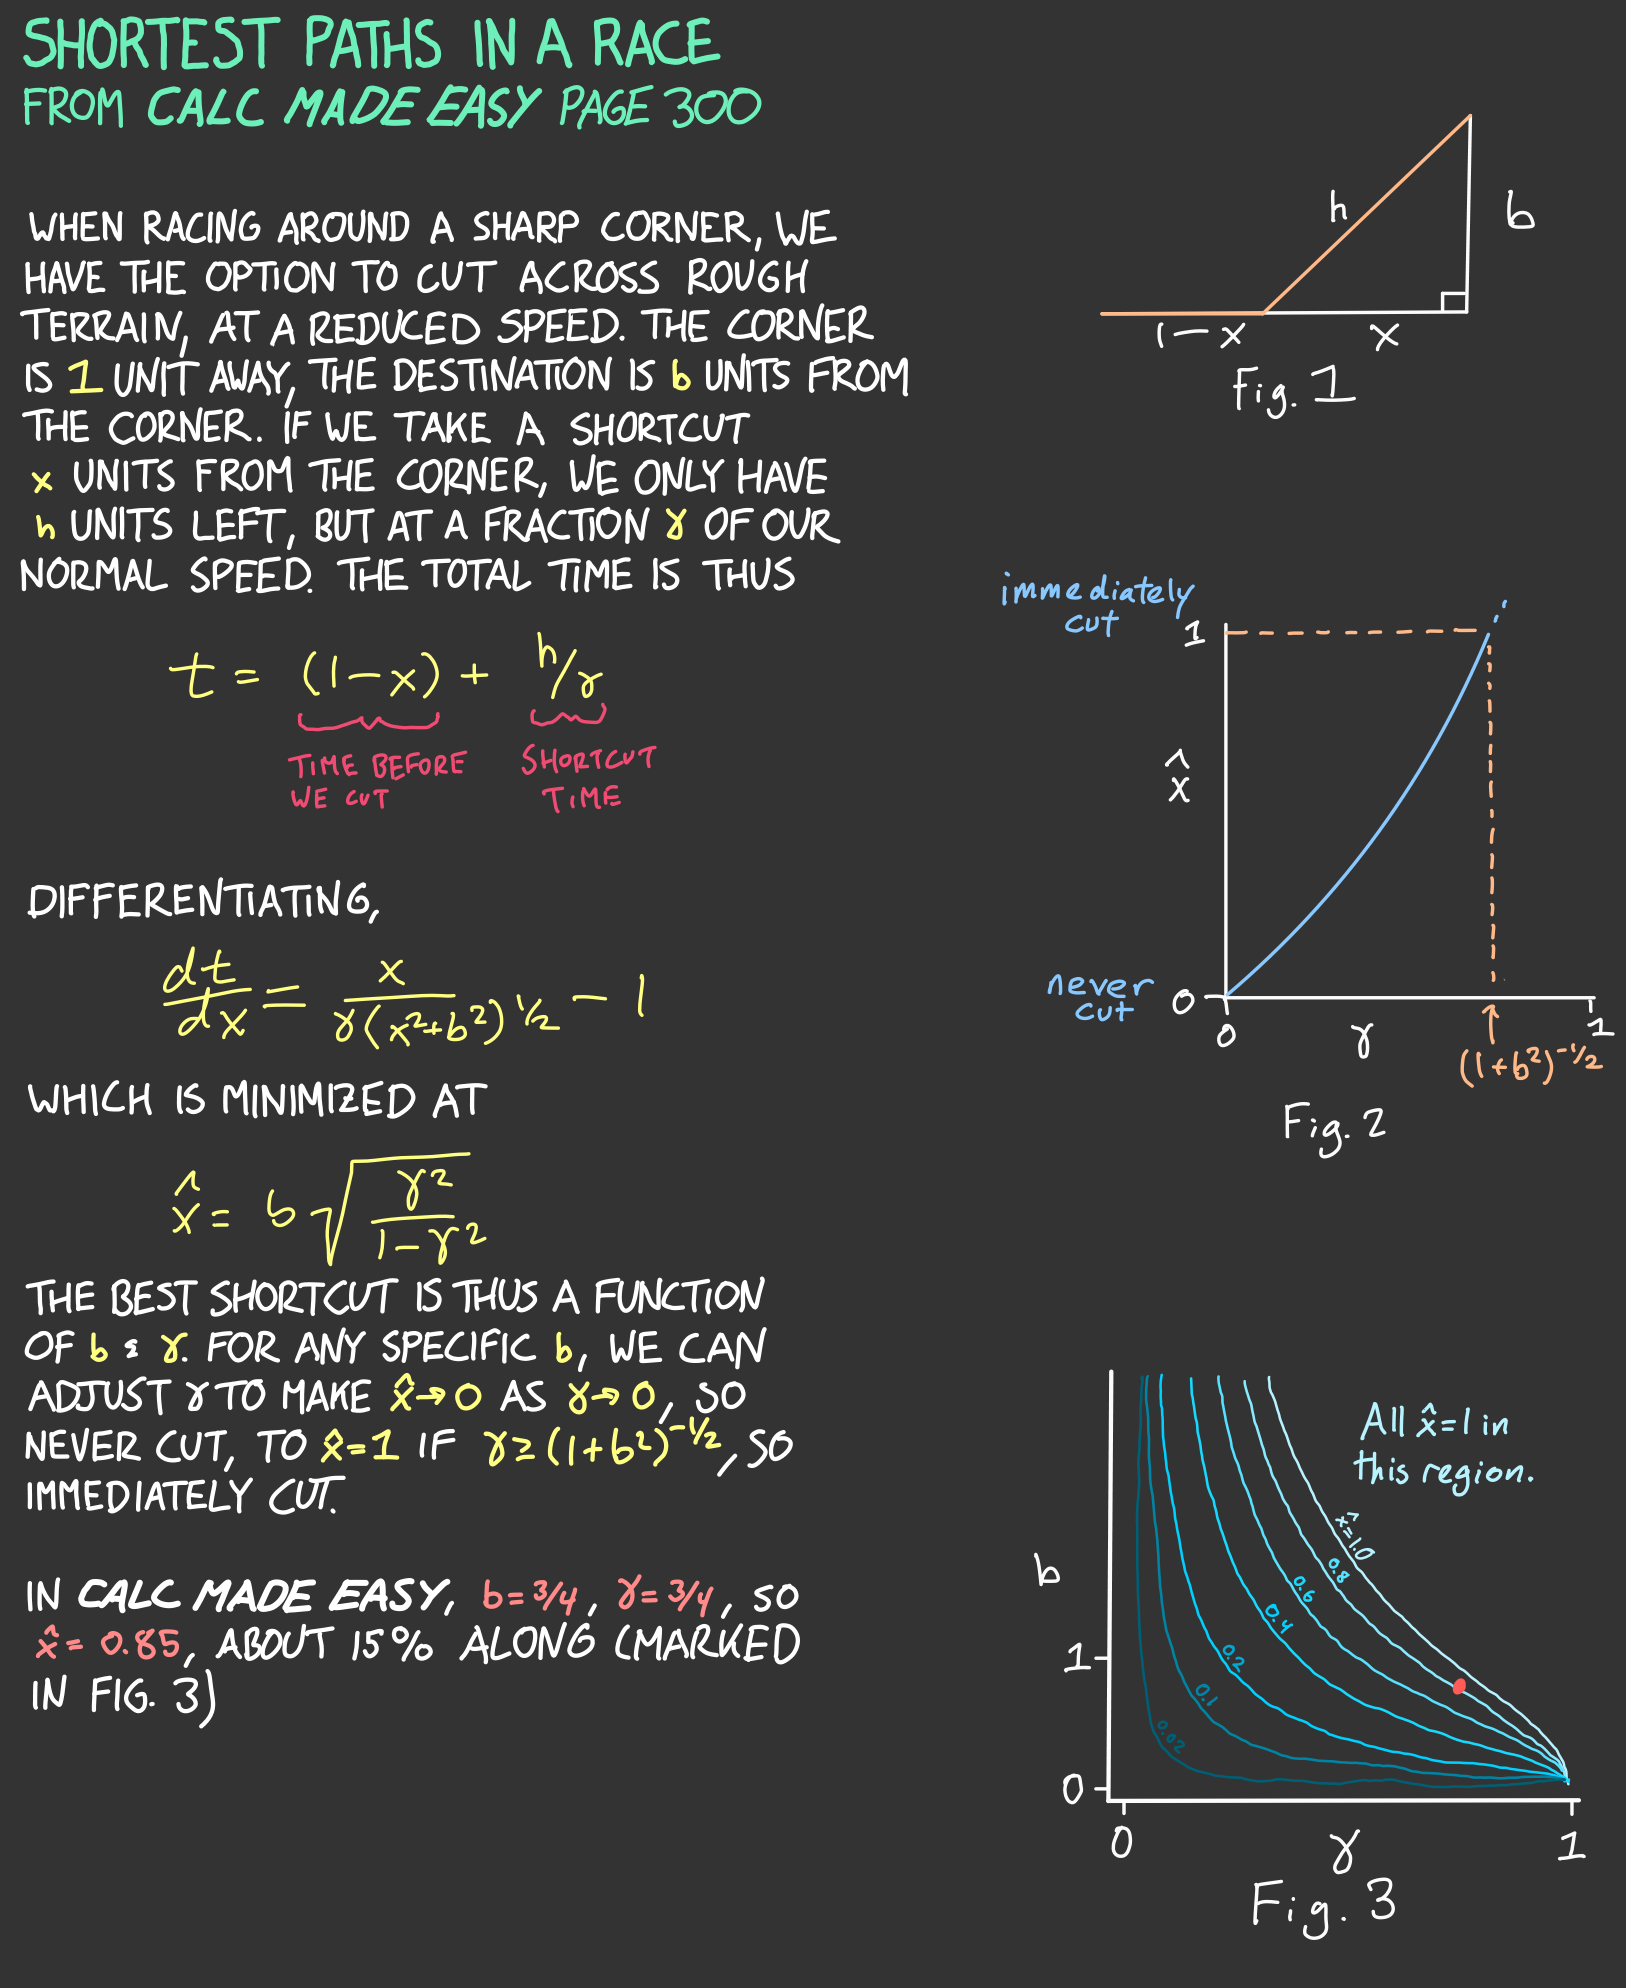
Decision Trees in a Go game
Beheim, B. (2025), Evolutionary Human Sciences. | Paper | Code and data
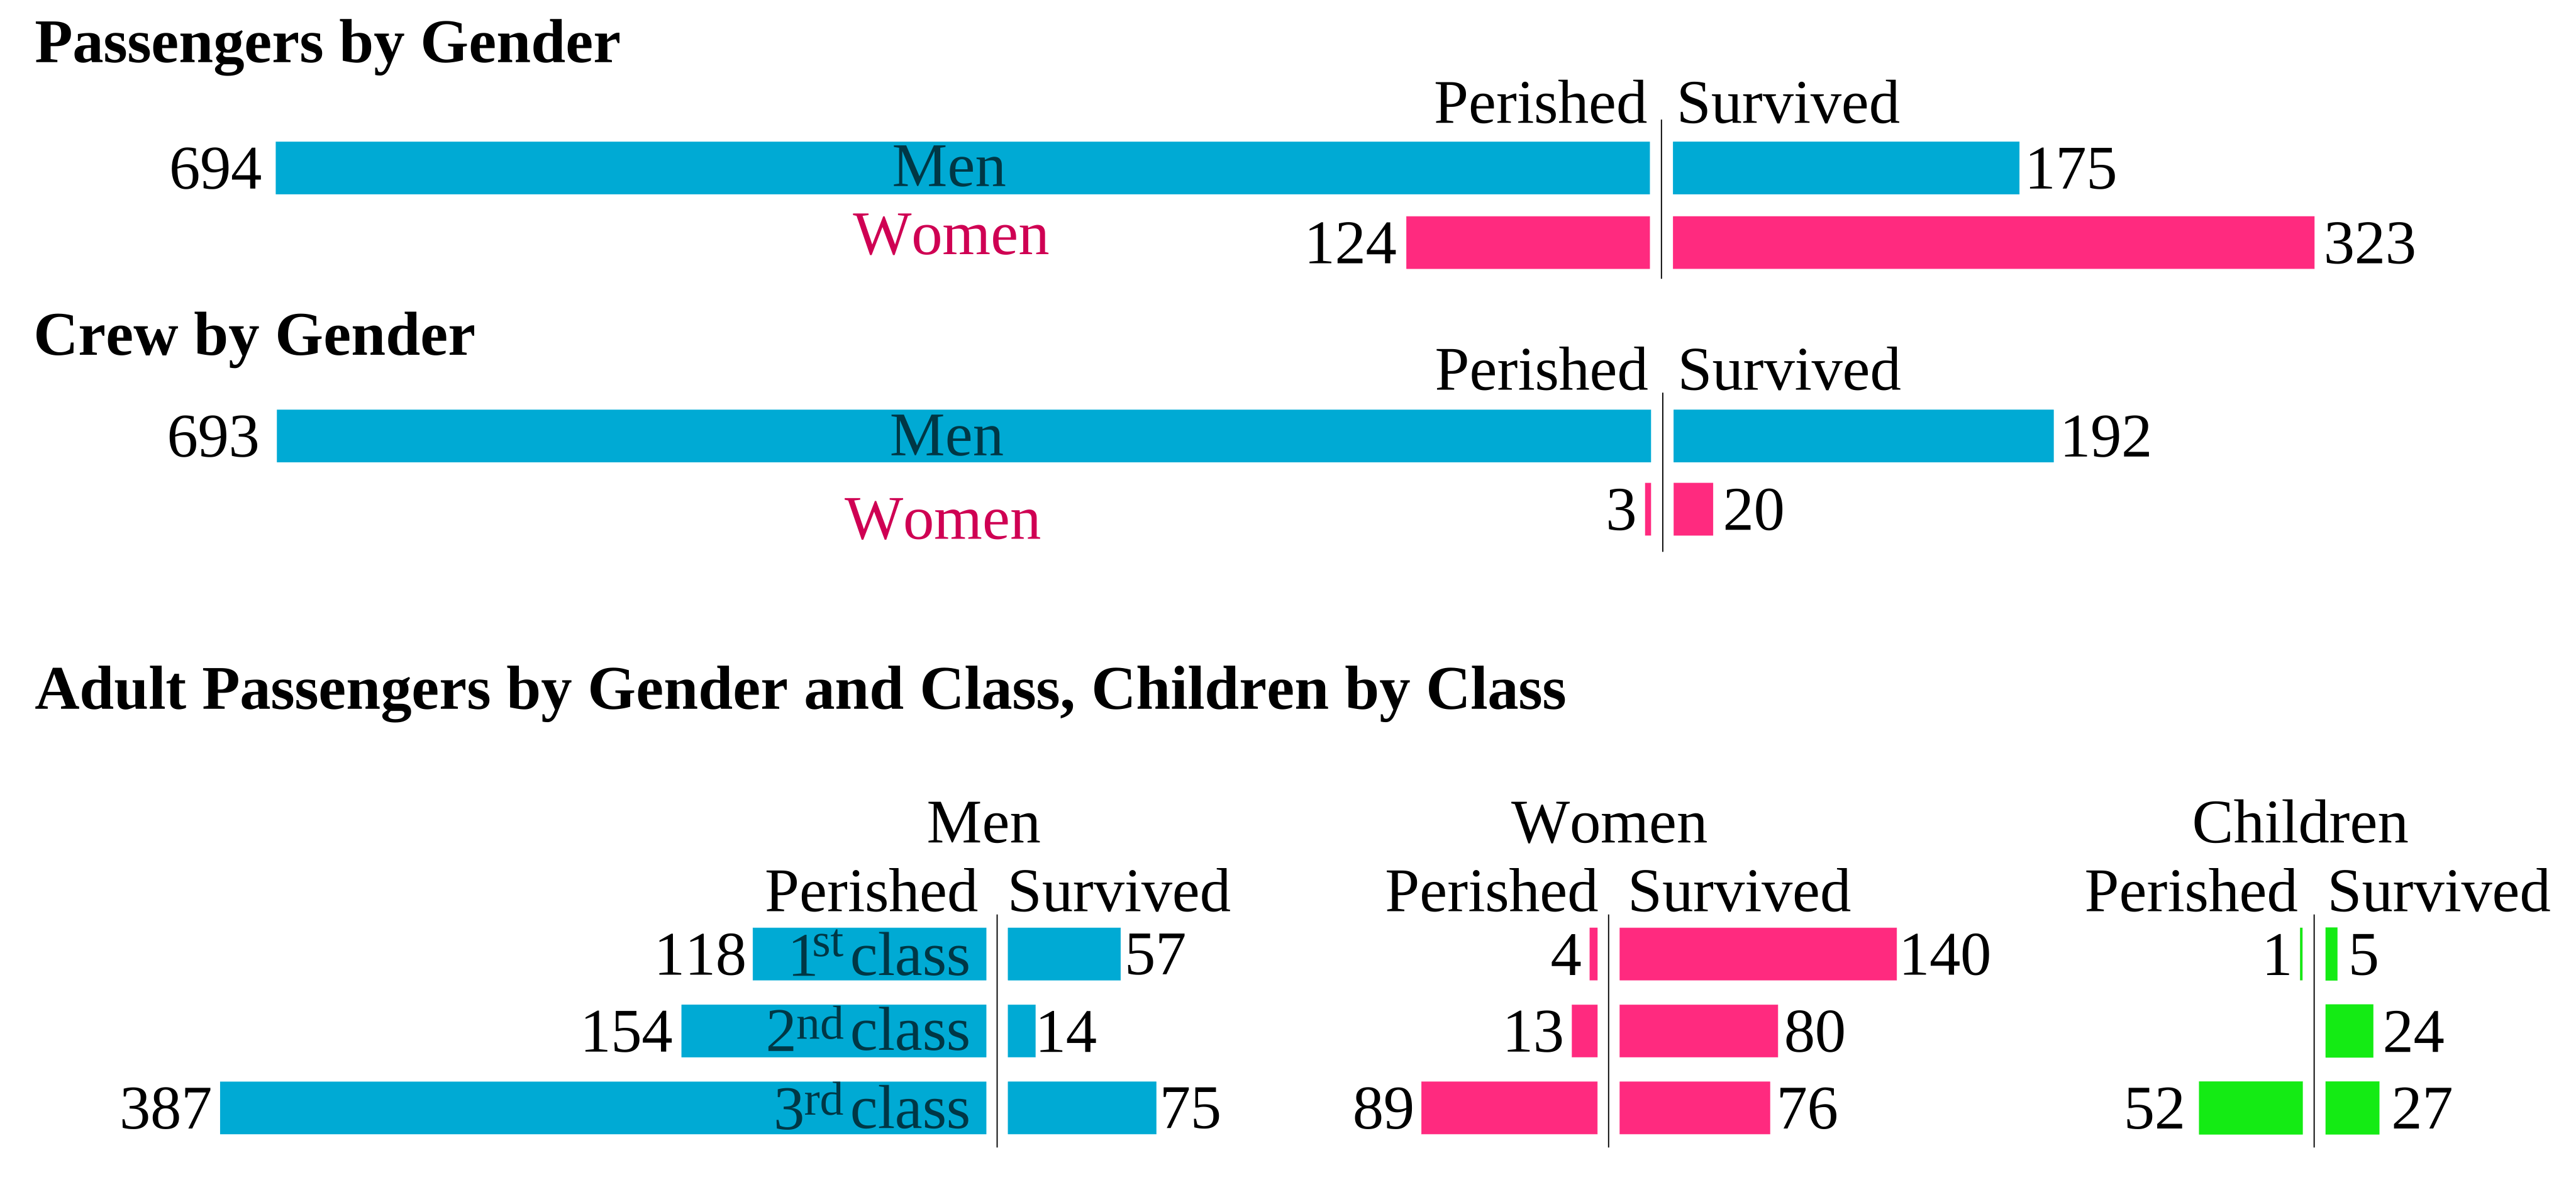
Death and Survival on R.M.S. Titanic