Indoor rowing & data science with R
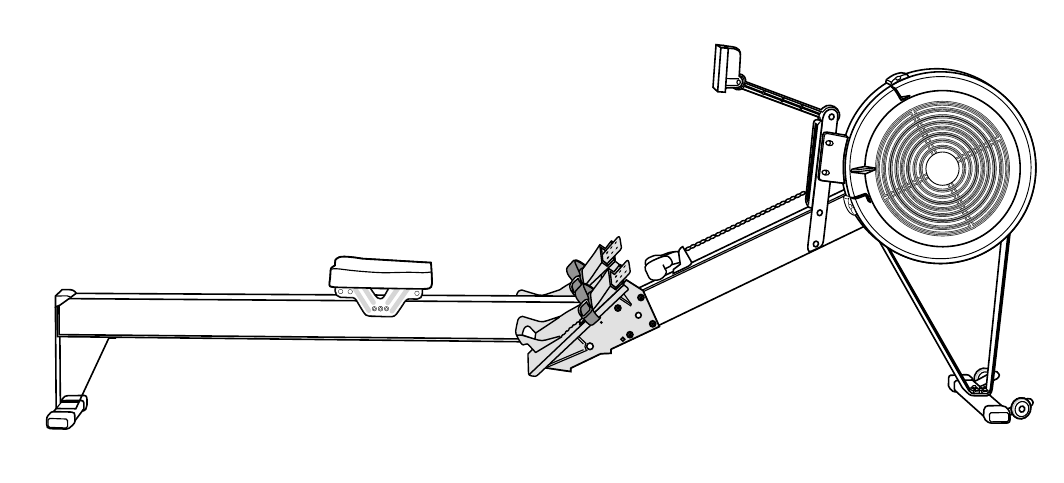
Figure 1: Concept2 Model D ergometer
Since 2014, I’ve been using a Concept2 indoor rowing machine. I’m not a very strong rower, but I enjoy tracking my progress from the great data stored by the PM5 on-board computer. Parsing the raw data is a bit tricky, so I wrote an R package, c2ergometer, to painlessly manage a database, and developed some data visualizations using the R language to track my rowing performance. Here, I’ll show some of my favorites.
Rowing Speed, Power, and Energy
During a row, the Concept2 Performance Monitor saves running averages for preset observation intervals called splits. Rowers care most about the split time, the time to travel 500 meters; the lower the split time, the faster the rower. The total distance traveled in a particular row is also critical, with 2-kilometer events the standard racing distance. Together, these numbers give a good basis for comparing rows, and rowers.
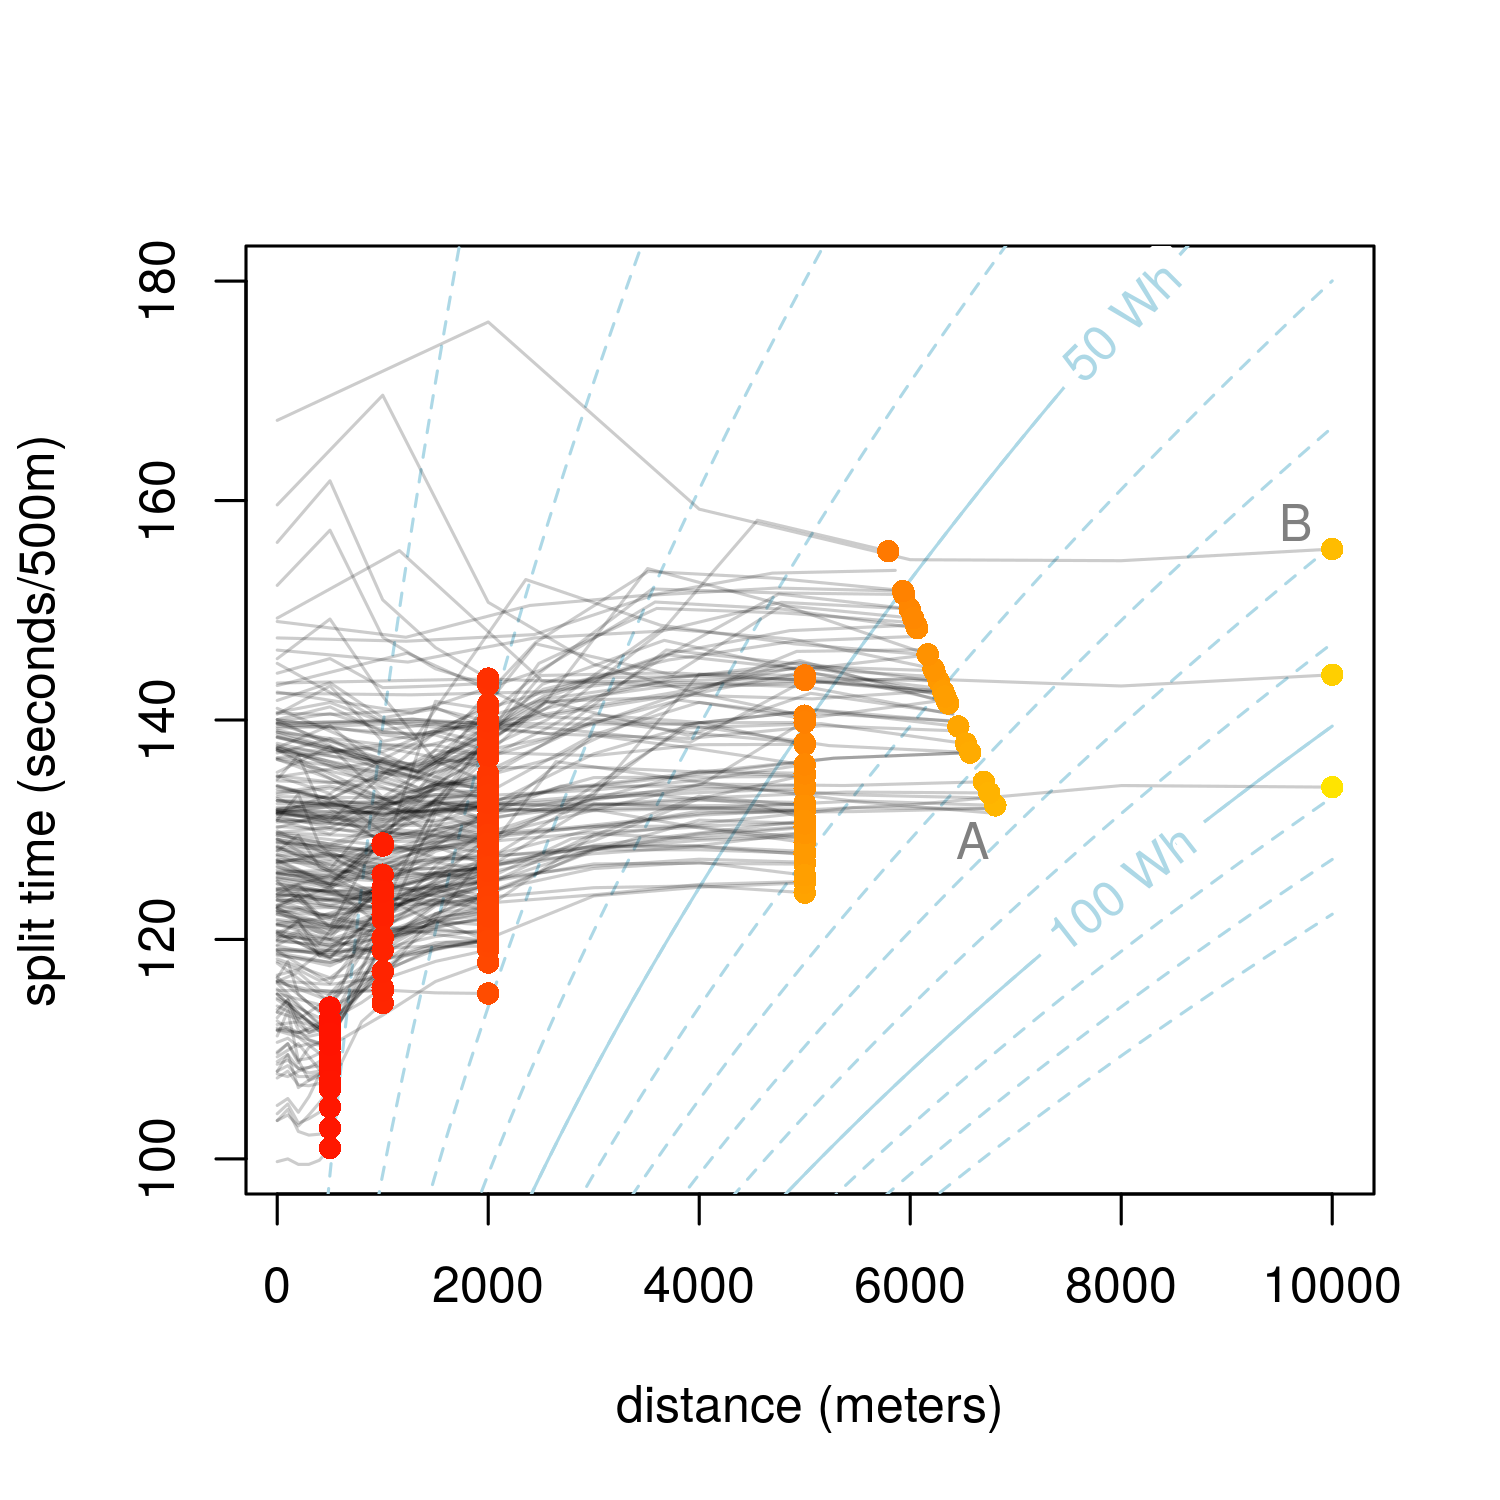
Figure 2: workout distances and split times, with energy isoclines
In Figure 2, I’ve plotted some of my workouts distances against their average split times. Each workout is a line, curving up and down as my speed changes, and ending in a colored dot (I shaded the colors by Wattage, see below). The fixed-distance rows all end at the same point on the x-axis, but faster rows have lower y-axis values. For the 30-minute rows, the distance rowed varies along a curve, depending on how fast I was going.
This graph highlights the pattern of my personal bests for each event. My fastest 500m sprints take about 100 seconds (1:40). For the 2000m event, I’ve finished with a split time under 2 minutes for 2000m sometimes, but I’ve never done this for 5K or higher. As the distance increases, I also get slower.
There’s one more piece of information I’ve added to this graph, shown by the dashed blue lines. These represent lines of constant mechanical energy, measured in Watt-hours. Since the PM5 Performance Monitor can track the power added to the rower’s flywheel, we can find the average power for a known workout distance and average velocity.1 These lines also allow us to compare how much energy each row demands. For example, my personal best 30-minute row (point A) generated about 75 Watt-hours over about 7,000 meters, which is still less energy than a slow, casual 10,000 meter row (point B).
Stroke-Power Separation
Velocity is the key measure of performance in rowing, but not the only one. Another key metric from the Performance Monitor is the stroke rate, in rowing strokes per minute, which can help us understand a bit about a rower’s strength, endurance and approach to a race.
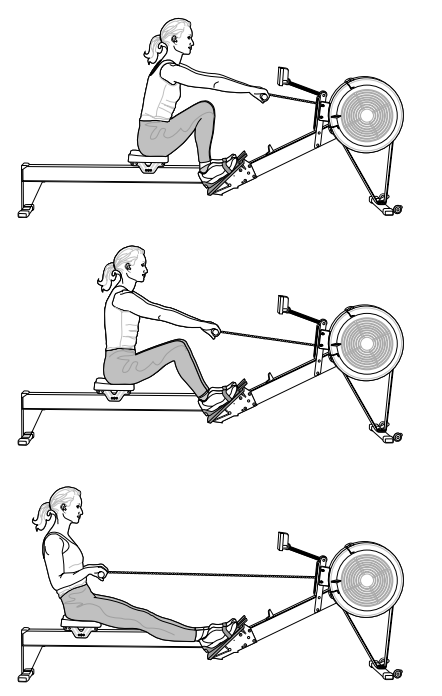
Figure 3: Proper stroke form illustration from the Concept2 manual
Watch this rower doing a 2K test:
Compare with this rower, also doing a 2K test:
Both athletes row the same distance, and they finish within a few seconds of each other. Yet their SPM is quite different - the first rows at 39 strokes per minute, finishing with a time of 7:11.7, while the second was going at 32 strokes per minute, yet finished about 7 seconds faster. Why?
The second rower goes through the stroke cycle slower, but is pulling harder, and so doing more work per stroke. This is related to the rower’s power output (and so the speed) by
$$ \frac{\mathrm{work}}{\mathrm{stroke}} \times \frac{\mathrm{strokes}}{\mathrm{time}} = \mathrm{power}. $$
Since power and stroke rate are supplied by the PM5, we can calculate the work-per-stroke using this formula, which leads to my second visualization:
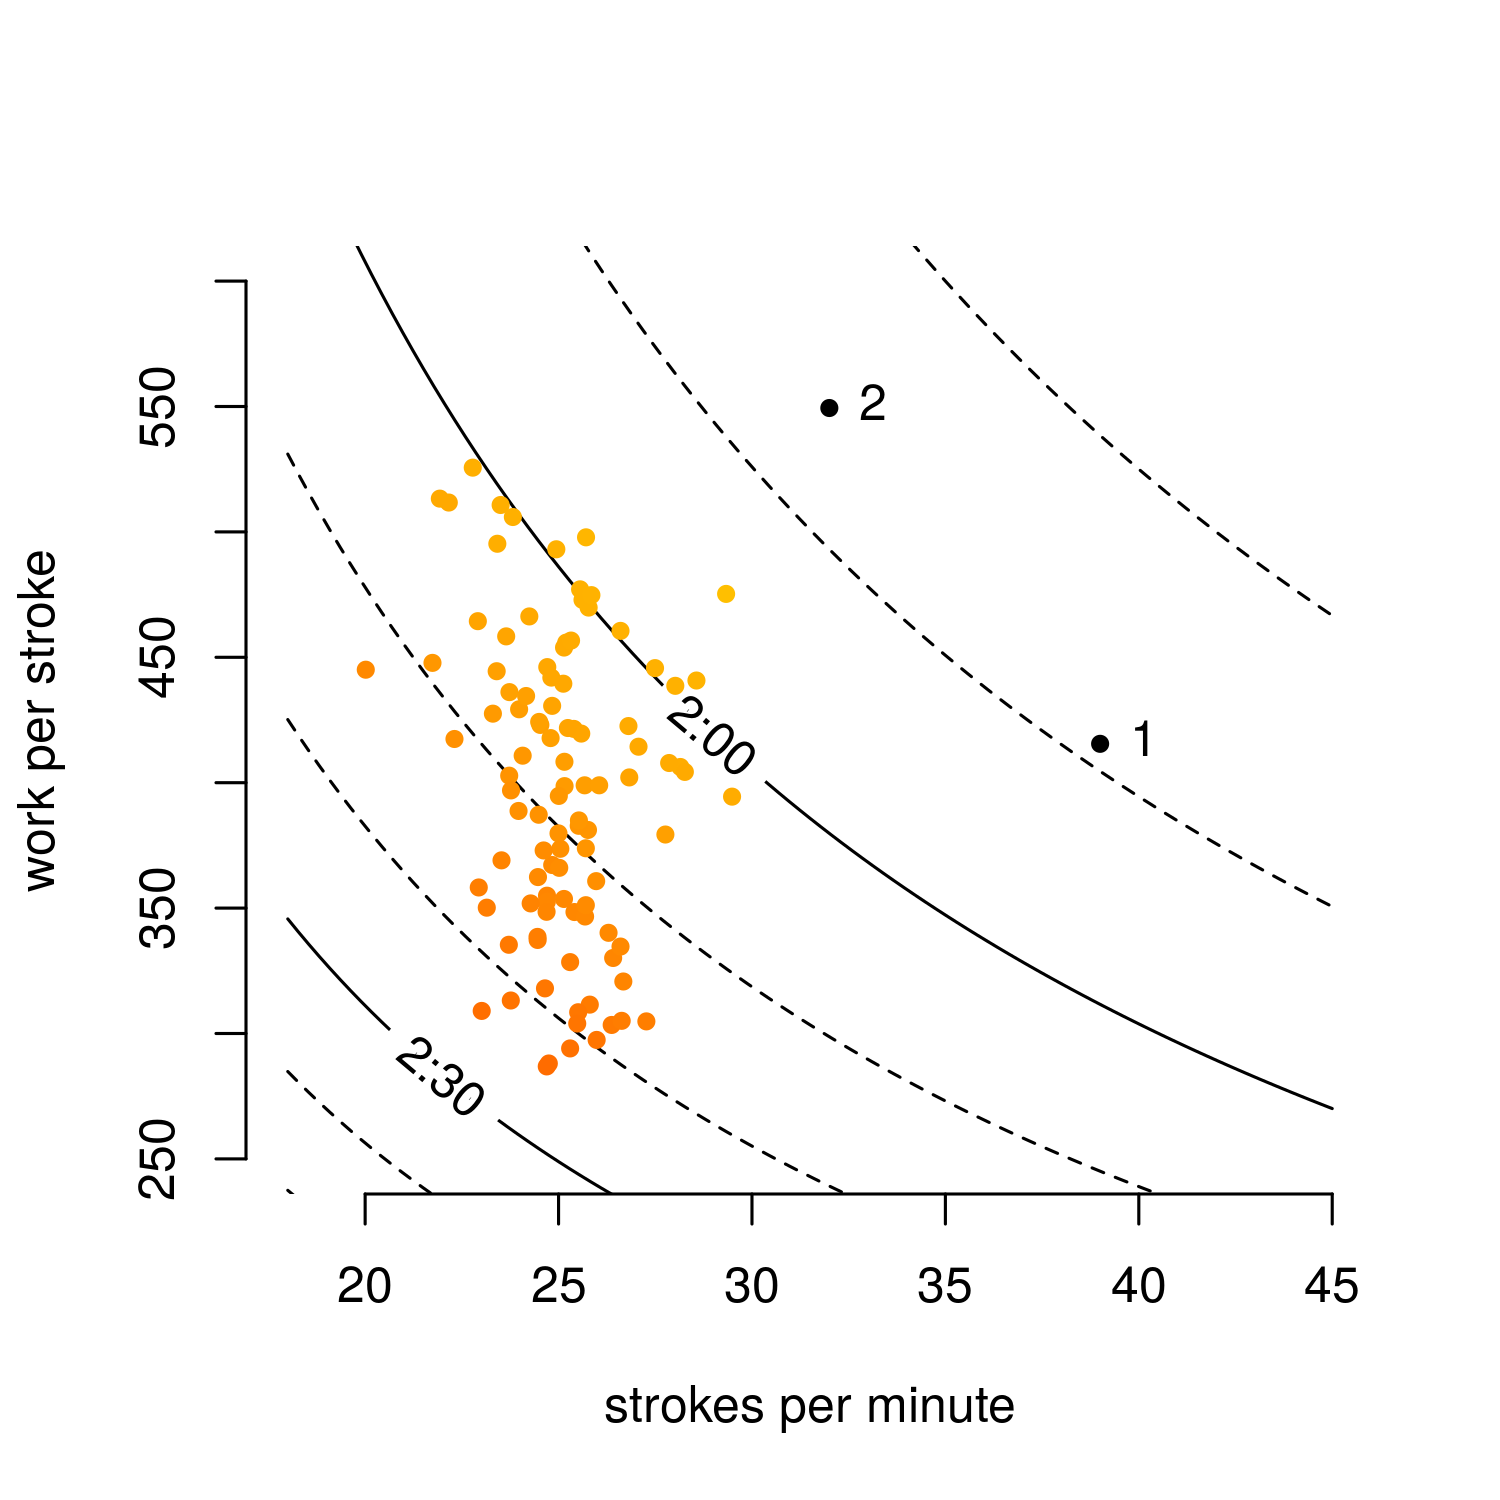
Figure 4: stroke-power decomposition for my rows (orange) and the two rows from the above footage
The curved lines trace constant split times, in increments to 10 seconds. That is, any point along the “2:00” line shows the exact combination of stroke rate and work-per-stroke that results in a 2:00 split time. We can see Rower 2’s got the lowest split time, Comparing my own rows, I can’t really row as fast as Rower 1 at 39 SPM, and I can’t pull as hard as Rower 2, who creates about 500 joules per stroke, so I’m unlikely to enter the sub-1:50 club anytime soon.
Cardiovascular Efficiency
The Performance Monitor also has the ability to connect to heart rate monitors, and for each split stores my average heart rate in beats per minute. Plotting my heart rate against the split time, I see the following relationship:
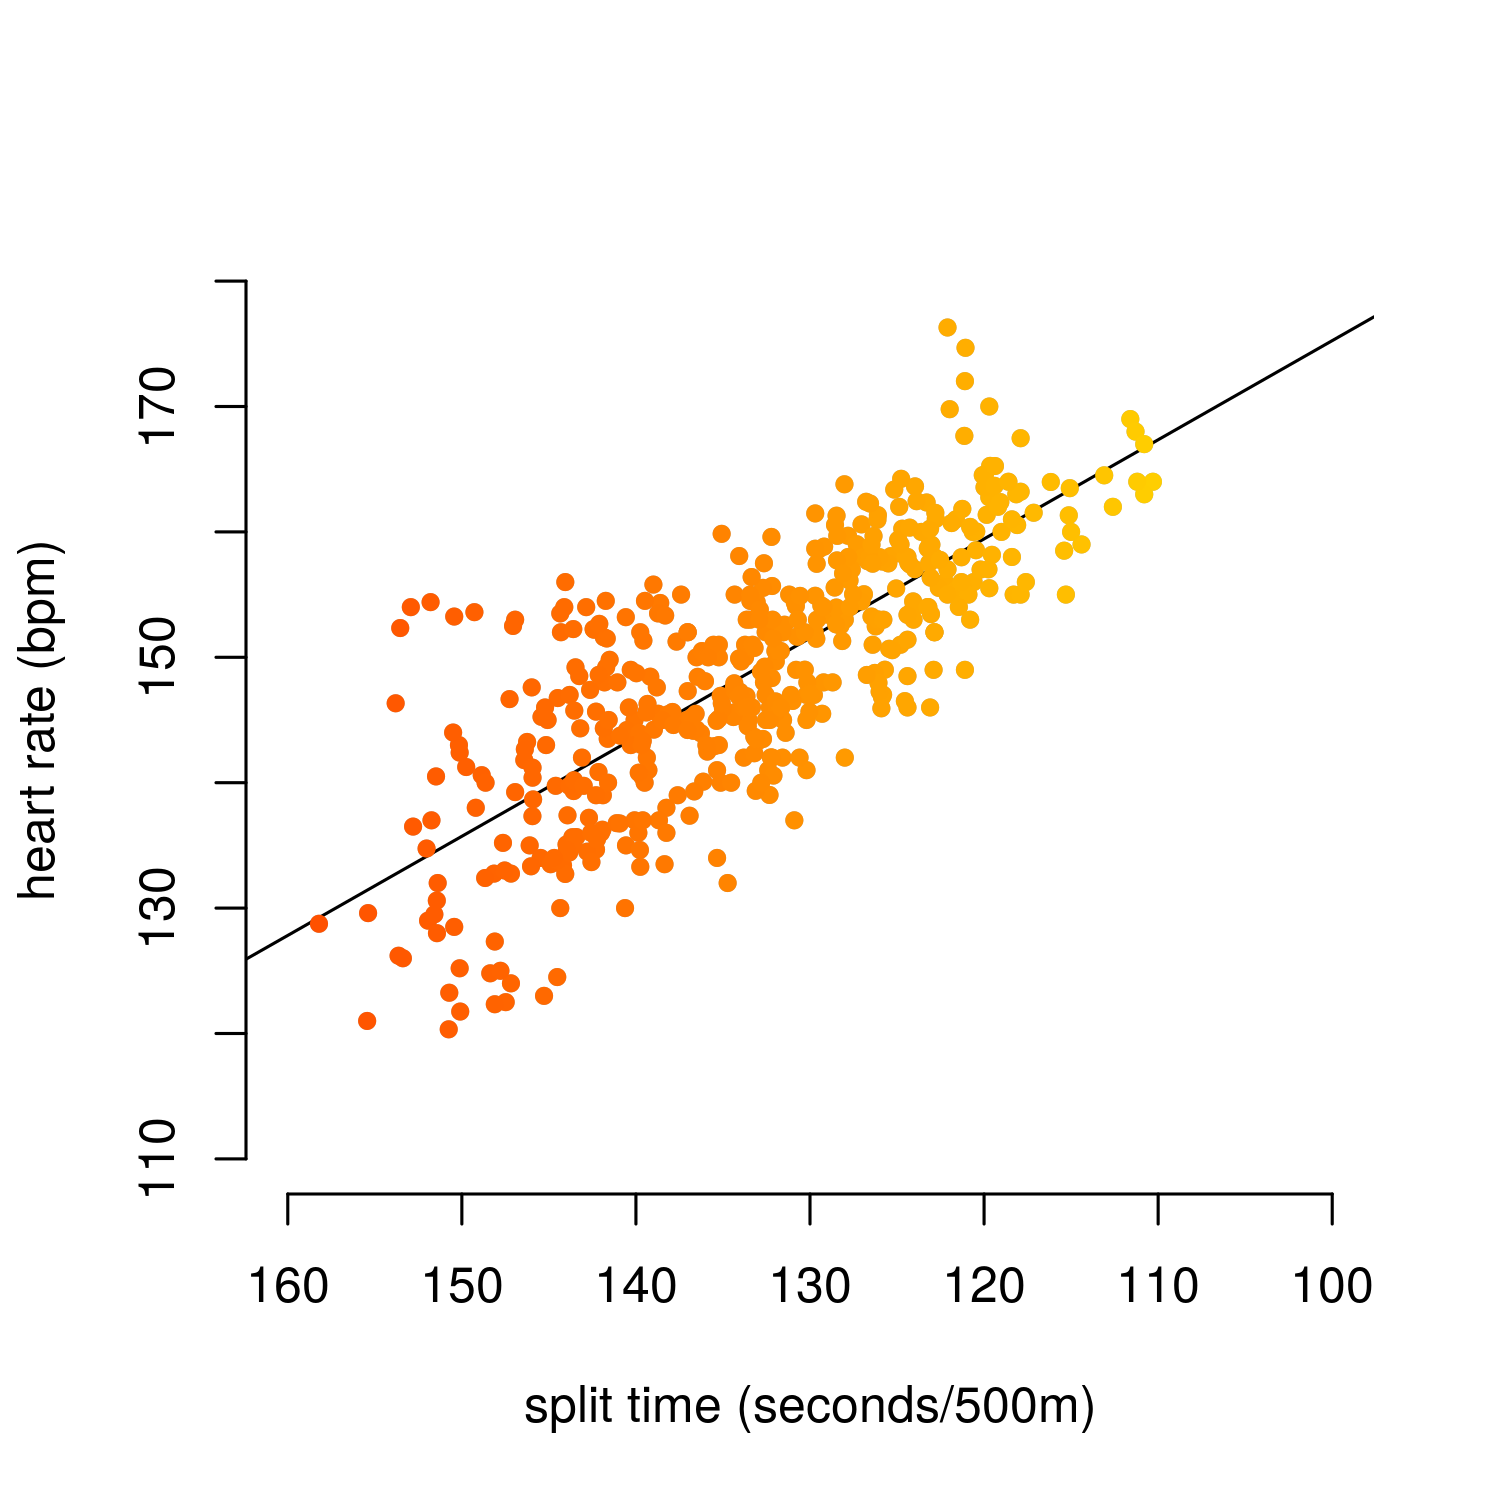
Figure 5: my split times and average heart rates, with linear regression line
There’s a pretty solid linear relationship here: the faster I go, the higher my heart rate, with each increase in 10 seconds requires about 8 BPM, up to my max heart rate in the high 170s.
This isn’t quite the whole story, though. Like the above with work-per-stroke, I’ve found it useful to separate power into heart rate and work-per-heartbeat, and graph that:
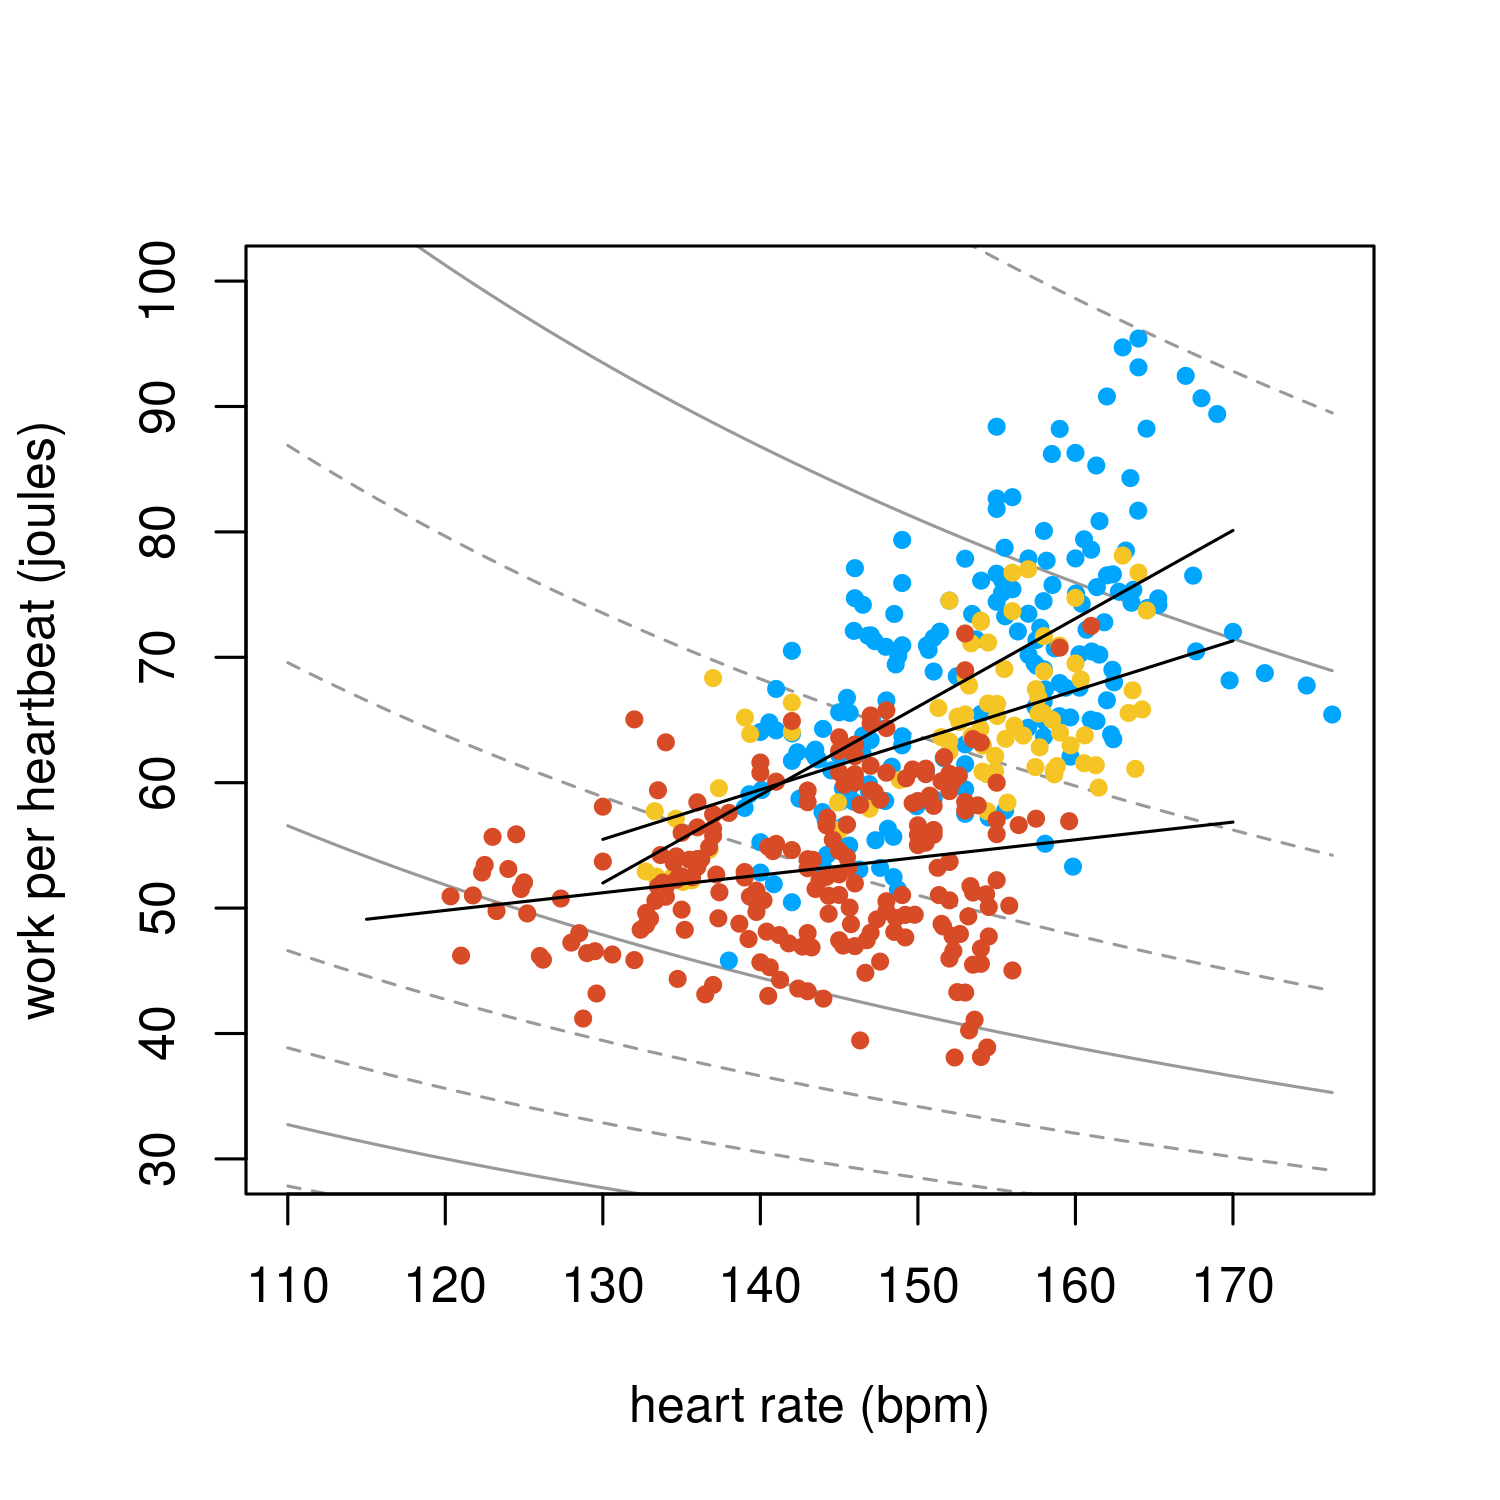
Figure 6: power decomposition by heart rate for 2000m (blue), 5000m (orange), and 30-minute (red) rows, with trend lines
On short rows (blue dots), a higher heart rate means more speed. But on long 30-minute rows (red dots), even with a high heart rate, I’m not going much faster. Why is this? My guess is fatigue. To put it another way, as I get tired, my heart rate goes up even as I hold a steady pace. I suppose that one metric for physical endurance, then, is the extent to which this slope stays nice and steep on longer rows.
Conclusions
Besides getting you tremendously fit, one of the appeals of this sport is all this good data, and how much you can learn from studying it. Rowing ergometers are low-impact and mechanically very simple, so I expect (and hope) I can keep tracking my data into the indefinite future.
References
The Concept2 Model D is the professional standard indoor rower.
My favorite videos on proper rowing form:
- https://www.youtube.com/watch?v=VE663Kg0c00
- https://www.youtube.com/watch?v=zQ82RYIFLN8
- https://www.youtube.com/watch?v=QPvYrfyGHi8
-
The Performance Monitor tracks the average power, $p$, supplied to the flywheel in Watts, related to rower velocity by $p = (2.8) (500/s)^3 $, where $s$ is the split time in seconds, and 2.8 is a constant used by the computer. Since power is simply energy per unit time, we can also calculate the mechanical energy added by the rower to the flywheel by multiplying by the total row time. ↩︎